Practical YARD Examples 0001: Generating class diagrams with YARD & Graphviz
So, recently I was looking at refactoring the current internal structure of YARD to improve the developer API and general stability improvements and I figured I would draw out the class diagram as a first step in figuring out what needed to stay and what needed to go. Problem was, having been away from the project for so long, I completely forgot what YARD looked like on the inside. I did not want to dig through the source; I wanted to see the project from afar to keep my design from being influenced by the current layout (in terms of implementation details). I really needed to visualize the project from a high level.
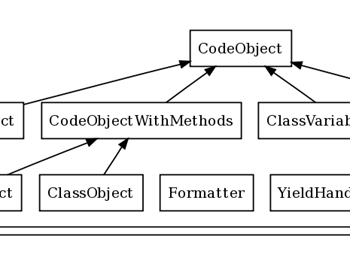
Using the raw data file that yardoc generates when it is run, I mocked up a quick tool called yard-graph which allowed me to visualize my project using Graphviz. Note that this is the same functionality that I described any developer could take advantage of in YARD’s very first release. Doing things like this is what YARD is all about. The results aren’t quite perfect due to both the incompleteness of the graph tool and the limitations of Graphviz, like how hierarchical mode is extremely strict about hierarchy and likes to make extremely wide graphs, but they’re highly suitable for my needs; actually, I would call them quite excellent for my needs. Take a look!
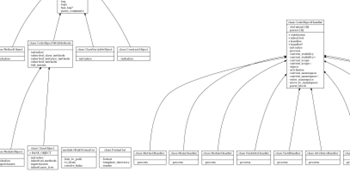
As an excercise, I also implemented the ability to show module dependencies (via include) and the public class API. This is what that looks like:
For those interested, this code lives in the diagram branch in Github (yea, I got a free invite and decided to try it out; I forgot / have no idea who invited me– please email me so I can thank you, by the way). After a rake install of the gem, you can run (in your root project directory, or maybe lib/ to ignore tests):
yard-graph --dependencies --empty-mixins --full | dot -T pdf -o diagram.pdf
This requires dot (part of Graphviz) and generates the diagrams with all the above options, module dependencies (--dependencies) and --full for the class/instance methods, constants and attributes info. The --empty-mixins flag shows empty modules as nodes instead of subgraphs (the delimiting boxes), since by default Graphviz ignores empty subgraphs. If you use modules as mixins and not just a way to namespace classes, you’ll want this on or you won’t see your modules.
I also highly suggest using a vector format for output like pdf as in the above example. Bitmap files can get really big. If you want proof, check out the full class diagram of the rails source I generated and imagine that as a bitmap.
Hopefully I can get some more practical uses of YARD up in the next coming weeks for people to see how awesome it is!
 I'm Loren Segal, a programmer, Rubyist, author of